Tackle it Tuesday: Budgeting

Welcome to Tackle It Tuesday, a social media series where an autistic employee at AAoM (yours truly) writes workplace (and now more!) tips to better cope with the stresses of a world not built for neurodiversity.

While creating the latest entry for AAoM’s social platforms, I realized that social media alone isn’t the ideal archive for all the past Tackle It Tuesday entries, as it shares space with all the other important work AAoM does. So, this blog companion was born!


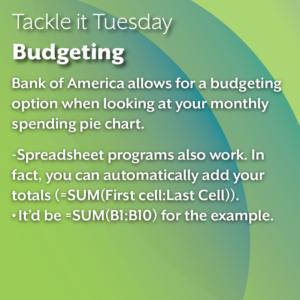
This Tackle it Tuesday is on budgeting. I am not a financial advisor, but I want to provide the tools I use to manage my money. That way, you can add up all your costs and see what you can work with (inflation and the economy notwithstanding)

An image on a green background.The text reads: Tackle it Tuesday: Budgeting
Money is a pain, and it is difficult. However, there are techniques I use to make handling it easier.

The key is to figure out what you need to pay for, how much you need to pay for, and how much you bring in per month, and subtract that to see what remains.
 

An image on a green background. On the right, there are graphics of a lightning bolt for electricity, a faucet running water, and red squiggly lines for heat.

The text reads: Tackle it Tuesday: Budgeting
If you have to pay utilities for the first time: ask your utility company(s) what the highest average is for your situation, or look it up on Google and compare multiple results. 
This works for many variable costs

An image on a green background. The budgeting sheet is blue text in a white box with that same blue as the border.

The text reads: Tackle it Tuesday: Budgeting
I will give an example sheet, but everyone's expenses are different.
Monthly Income: 2,000
Rent: 1000 (splitting between multiple people in this example)
Utilities: 100 (always overestimate this one by a little bit, you can ask the provider what the highest average is)
Electricity: 100 (always overestimate this one too)
Food: 300
Internet: 55
Rent Insurance: 20
Toiletries (dishwasher pods, cleaning stuff, bathroom stuff, etc): 30
Laundry (I pay to use a washer and dryer): 25
Gas: 60
Total: 1,690

That number is how much you have left over for entertainment, savings, or emergencies. If a month is too abstract, you can divide the leftover money by 4 to get a rough weekly amount.

By this metric, 310/4 would be 77.50 dollars per week.

An image on a green background.

The text reads: Tackle it Tuesday: Budgeting
Bank of America allows for a budgeting option when looking at your monthly spending pie chart.

-Spreadsheet programs also work. In fact, you can automatically add your totals (=SUM(First cell:Last Cell)). 
It’d be =SUM(B1:B10) for the example.

An image on a green background. On the bottom right, there are three sheets of paper that are (from left to right) red, green, and blue. All of them have different budget plans written on them in white ink.

The text reads: Tackle it Tuesday: Budgeting
Again, everyone’s finances are different. You can create your chart, and have someone you trust look over it. 
It’s easy to miss things when it comes to expenses, after all.

An image on a green background.

The text reads: Tackle it Tuesday: Budgeting
What can you save on and what can you spend more on?

For food, utilities, and electricity, those are variable costs I overestimate on, just in case.
For toiletries, I estimate lower. 
If I find out I have more money left over from overestimating, I let some of that be fun money.

RECENT ARTICLES

PAST ARTICLES